Referral intake reviewES
Legal ExplainerPedestrian AccidentsInformational

California Pedestrian Crash Data: Time, Place, and Records

This California-focused guide is for readers who want to compare official pedestrian crash patterns with the records from one specific event. It explains how to separate population data from event evidence, reconcile time and place, preserve sources, and document limits without turning a statewide pattern into a legal or factual conclusion.

Published

August 26, 2026

Updated

August 26, 2026

Reading time

13 min read

Jurisdiction

California

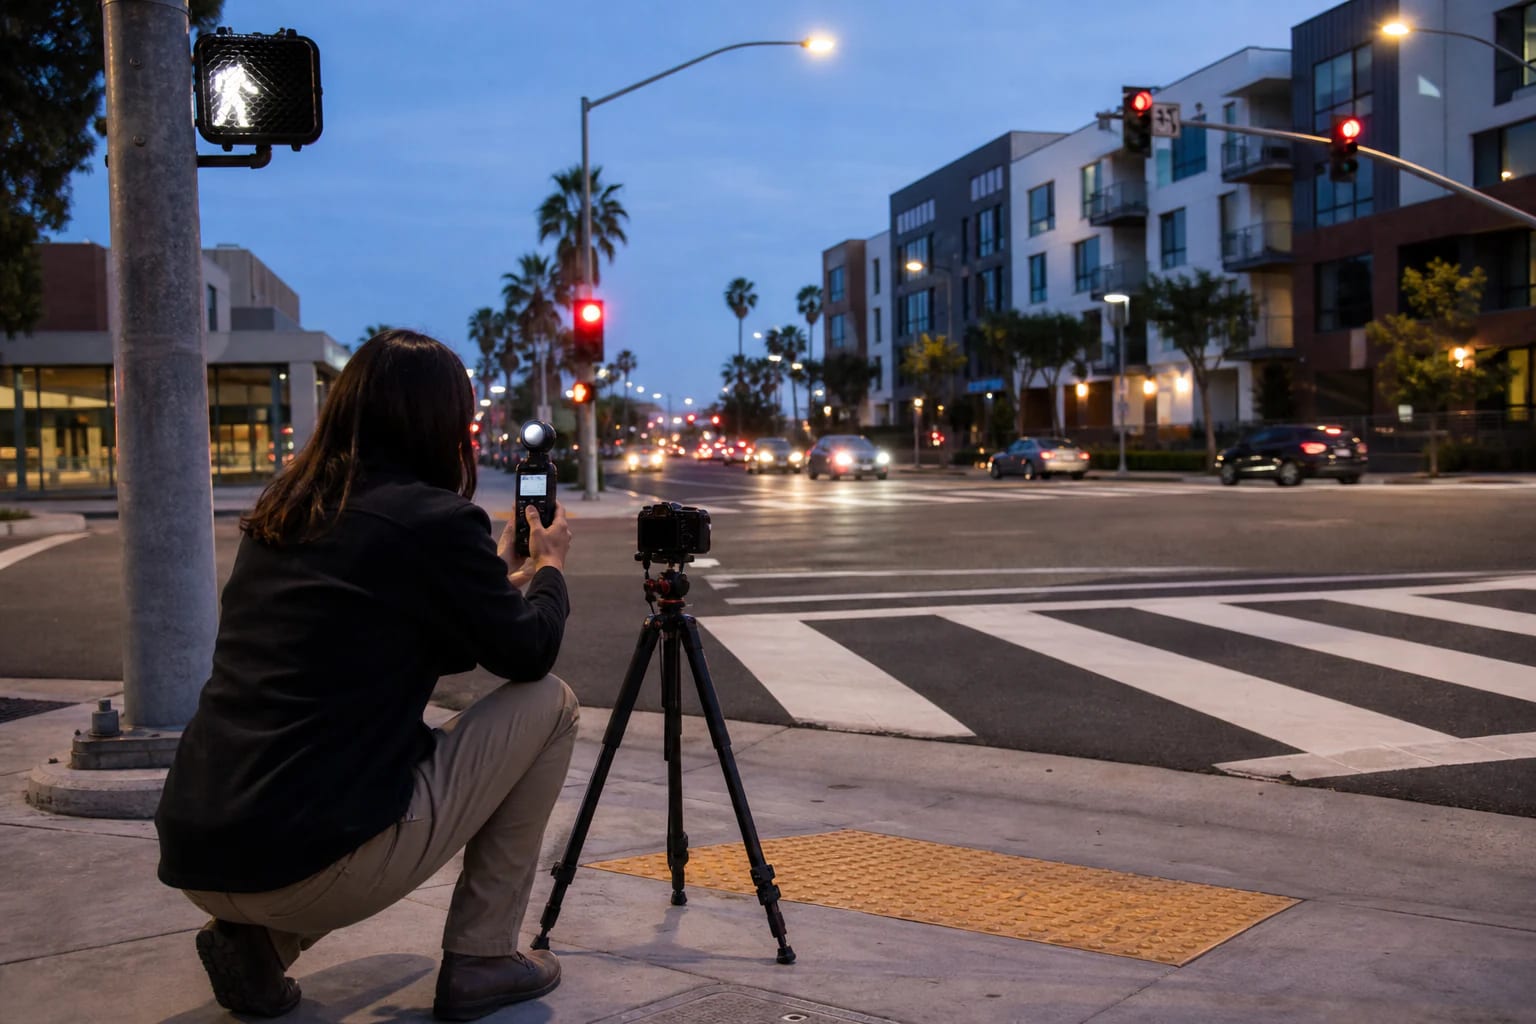
Pedestrian-safety researcher documenting crosswalk lighting and traffic signals at a California intersection at dusk
Editorial illustration: a field researcher documents crosswalk, signal, lighting, curb-ramp, and roadway conditions at dusk; no crash or identifiable victim is shown.

Quick answer

California’s pedestrian crash data can show statewide time, place, and severity patterns, but it cannot prove what happened in one collision. Use official figures as a question-builder, then keep a separate event worksheet for clocks, locations, records, and limitations. Label every dataset, preserve originals, and treat any mismatch as a follow-up issue—not a fault conclusion.

Key takeaways

  • Statewide patterns describe groups of crashes; they do not prove what happened in one event.
  • Keep fatality data, serious-injury data, and property-damage-only events in separate lanes.
  • Reconcile clocks before treating timestamps as a reliable sequence.
  • Record what a source does not contain as carefully as what it does contain.
Hurt Advice Editorial Team

Prepared by

Hurt Advice Editorial Team

Editorial Research and Publishing Team

Source-checked editorial publishing

Why trust this article

Prepared by the Hurt Advice Editorial Team from current official California, federal, and UC Berkeley traffic-safety sources. Data definitions and limitations are stated near the relevant claims. No attorney reviewed the displayed version.

Recent update: Original publication added a source-labeled California pedestrian data summary, a three-layer data-to-record worksheet, time and place reconciliation tools, a preservation script, and dataset limitations.

At a glance

What this guide helps you decide

Start with the question that brought you here, identify the records that can verify the facts, and use the related guidance only where it helps. This article addresses pedestrian accidents questions in California.

Main question

Decide how this topic may apply to your situation

Use "California Pedestrian Crash Data: Time, Place, and Records" to sort the facts you know, the questions still open, and whether a pedestrian accidents resource or consultation may be useful in California.

Guide map

Start with the sections most relevant to you: How to use this guide, What the official California data show, Keep each crash dataset in its own lane

Move through the article by issue, not by guesswork, so liability, medical proof, insurance pressure, deadlines, and next steps stay connected.

Records to gather

Connect these subjects to your records: California pedestrian crash data, pedestrian safety, SWITRS, FARS

Compare the topic with records, photos, medical visits, police reports, insurer letters, and local claim details before relying on a general answer.

Trust check

Use the source trail before acting

This page includes 6 source references plus internal next-step paths so readers can verify where the guidance comes from.

Before you rely on this guide

This article is written for people dealing with injury-law questions in California. It is meant to help you understand the issue, not replace legal advice about your specific case.

What to do after this article

Start with the quick answer, skim the table of contents, and then use the links below to move into the practice area, author archive, or resource page that turns general guidance into a clearer next step for your situation.

How to use this guide

This guide is for a pedestrian, family member, witness, or records helper who needs to understand what statewide crash data can—and cannot—say about one California event. It does not decide fault. Start with the broad pattern, build a separate event record, and write down every uncertainty instead of filling gaps with assumptions.

Use the California pedestrian-injury information hub for broader claim context and the California Injury Evidence Center when you want the site’s wider data catalog. This article has a narrower job: convert time-and-place data into questions that can be checked against records from one crash.

  • Statewide patterns describe groups of crashes; they do not prove what happened in one event.
  • Keep fatality data, serious-injury data, and property-damage-only events in separate lanes.
  • Reconcile clocks before treating timestamps as a reliable sequence.
  • Record what a source does not contain as carefully as what it does contain.

What the official California data show

The 2025 SafeTREC pedestrian fact sheet reports 1,106 pedestrian fatalities in California in 2023. It also reports that 22% of California pedestrian fatalities occurred at intersections. For fatal pedestrian crashes, 51% occurred from 6 p.m. to midnight, and 47.2% occurred on Friday, Saturday, or Sunday. The peak period identified in that fact sheet was Friday from 6 p.m. to 9 p.m.

Those numbers are descriptive, not a fault formula. They do not show that darkness, a weekend, or an intersection caused a particular collision. They also do not establish whether a driver, pedestrian, roadway condition, vehicle defect, or some combination contributed. Use them to form neutral questions: Was it actually dark? Was the location coded as an intersection? Were temporary conditions present? Do the event records agree on the time?

SafeTREC separates fatality measures drawn from FARS from serious-injury measures drawn from provisional SWITRS. That distinction matters. A chart about fatalities cannot be silently substituted for a serious-injury estimate, and provisional California data may change as reports are completed or corrected. When you quote a number, label the year, population, severity, geography, and source.

Keep each crash dataset in its own lane

The federal Fatality Analysis Reporting System, or FARS, is a census of fatal motor-vehicle traffic crashes meeting federal criteria. The NHTSA 2023 pedestrian fact sheet reports national fatality and injury estimates and explains its pedestrian definition. It is useful for national context, but national totals should not be presented as California results.

SWITRS is California’s crash-record system maintained from law-enforcement reports. The TIMS SWITRS Summary offers free mapped and tabular access to fatal and injury crash data, with city and county filters and several severity choices. TIMS says its summary is updated quarterly and identifies the current CHP-data update date on the tool. A later update can change what is available for a recent year.

The Caltrans Road Safety Data Resources page explains that California Crash Reporting System data and tools such as TIMS serve different users and purposes. It also notes that TIMS uses fatal-and-injury crash records and excludes property-damage-only crashes. Absence from a TIMS result therefore does not prove that no incident occurred. Save the filter choices, access date, and visible data status with any export or screenshot.

Build a three-layer data-to-record worksheet

Layer one is the population pattern. Write only what the chosen dataset supports: for example, “California fatal pedestrian crashes in 2023, FARS measure, summarized by SafeTREC.” Include the source URL, access date, severity, geography, and whether the underlying year is final or provisional. Do not add a conclusion about the individual crash.

Layer two is the event record. Create rows for the reported collision time, location, light condition, roadway and intersection coding, pedestrian position, vehicle movement, signal phase if relevant, witness vantage points, emergency response, and medical documentation. Link each row to the item that supports it. The crosswalk signal timing guide explains controller and timing records; the 911 and dispatch records guide focuses on emergency-system timestamps.

Layer three is the limitation log. Note missing video, unsynchronized clocks, unclear diagrams, changed street conditions, estimated times, unavailable records, and conflicting terminology. A blank cell means “not established,” not “did not happen.” This layer protects the worksheet from becoming a story that looks more certain than the evidence.

A useful worksheet has six columns: question, source or custodian, stated time or place, confidence level, mismatch or gap, and next verification step. Keep the original file name and a working copy. If you annotate an image or map, preserve the untouched source beside it.

Reconcile the clocks before building a timeline

Start with a clock inventory. Common candidates include a 911 call receipt, computer-aided dispatch entry, body-camera or patrol-car video, nearby surveillance, transit or fleet video, a pedestrian signal controller, vehicle data, phone media metadata, ambulance records, emergency-department arrival, and the narrative crash report. Not every system exists for every event, and not every record is public.

Choose one anchor only after you know how it was created. A dispatch timestamp may be system-generated; a report narrative may contain a later estimate; a witness may reasonably round the time. Write the source next to each time and preserve time-zone or daylight-saving information. For a camera, ask whether the displayed clock was verified, offset, or reset. For a screenshot, keep enough surrounding frames to show sequence rather than isolating one image.

Then make a comparison table with columns for source clock, displayed time, known offset, adjusted working time, and basis for the adjustment. Never “correct” the original file. If a storefront camera runs four minutes slow and that fact is documented, record both the displayed time and the supported offset.

Sunset and streetlight conditions can help frame questions but are not substitutes for scene evidence. Compare official weather or solar information, roadway lighting, photographs, witness observations, and camera exposure. A dark-looking frame may reflect camera settings. A lit streetlamp does not by itself establish visibility from a driver’s or pedestrian’s actual position.

Reconcile place, roadway, and intersection coding

Use the report’s location description as a starting point, not the final map. Compare the collision diagram, measured distances, lane markings, curb ramps, crosswalks, shoulders, medians, driveways, bus stops, construction zones, and sight obstructions. Photograph the area from safe public positions only; do not enter traffic lanes or private property to recreate a view.

Separate three questions that are often blurred together: where the impact was reported, where a person or vehicle came to rest, and where the first visible trace or object appears. They may be different points. Preserve any scale, north arrow, measurement notes, and legend on the original diagram. If an online basemap or street image is used, record its imagery date because the street may have changed.

Intersection status can depend on the dataset’s coding rules, not everyday language. A crash near a corner may not be coded the same way as one inside an intersection. Likewise, urban or rural classifications and roadway ownership are administrative categories. Treat any mismatch between a crash report, map, and public dataset as a question for the relevant custodian.

Temporary conditions deserve their own row: road work, parked equipment, vegetation, event traffic, rain, glare, broken lighting, or altered signals. The pedestrian accident service guide can help frame relevant intake facts, while this worksheet remains neutral about legal responsibility.

Evidence checklist: what to preserve or identify

Preserve what you already lawfully possess before seeking more. Keep original photos and videos, full message threads, download receipts, report numbers, medical discharge papers, and correspondence. Avoid renaming or repeatedly editing originals. Make a working index with the item, date received, source, and storage location. Do not post sensitive medical or identity records publicly.

For public-agency material, identify the correct custodian before sending a broad request. A police or CHP report, CAD log, audio, signal-controller record, roadway maintenance record, or transit video may be held by different offices. Availability, retention, exemptions, and fees vary. Ask for a denial or partial-release explanation in writing rather than assuming a missing item never existed.

Private video can disappear quickly, but preservation is not the same as guaranteed production. Record the camera’s location, business or property contact, date and time range, and the person who received the request. Be specific enough to identify the event without demanding unrelated footage. The immediate crash checklist provides a broader evidence reminder.

For medical records, separate treatment timing from crash timing. EMS and emergency-department records can establish when care occurred and what was documented then, but they do not automatically resolve collision mechanics. Keep billing and clinical files distinct. If you need help organizing ambulance documentation, see the ambulance patient-care report guide.

  • Original crash-scene media and metadata
  • Law-enforcement report number, diagram, and supplements
  • 911, CAD, fire, EMS, and receiving-facility timestamps
  • Signal, roadway, lighting, maintenance, or work-zone records when relevant
  • Nearby video locations and preservation contacts
  • A source-and-limit note for every dataset extract

A practical request script and timing process

Begin with a short preservation message when a specific, potentially temporary record has been identified: “I am trying to preserve records relating to the pedestrian collision reported at [location] on [date] between approximately [time range]. Please preserve any responsive video or system records and tell me the correct process for requesting a copy. This request does not ask you to disclose unrelated material.” Keep proof of delivery.

For a public-record request, name the event and record family without embedding a legal conclusion: “Please provide the releasable incident report and supplements, CAD event log, and available audio for incident number [number], date [date], location [location], and time range [range]. If any item is withheld or unavailable, please identify the record category and applicable response.” The agency may require a portal or its own form.

Work in passes. On day one, preserve files already in hand and identify cameras and agencies. Next, log report numbers and send narrow requests. When responses arrive, keep envelopes, cover letters, metadata, and redactions with the record. Then reconcile clocks and locations. Finally, update the limitation log. Do not wait for every possible record before preserving what is known.

Deadlines can depend on the parties and claim type, including possible public entities. This article does not calculate a filing deadline. A delayed response to a record request does not necessarily extend a legal deadline. If timing may affect rights, seek case-specific legal advice promptly rather than relying on the worksheet.

Worked example: data creates questions, not answers

Assume a report places a pedestrian crash at 7:42 p.m. near a marked crossing. A nearby camera displays 7:38 p.m.; CAD shows the first call at 7:44 p.m.; an ambulance record shows dispatch at 7:46 p.m. The SafeTREC finding that many fatal pedestrian crashes occurred during evening hours does not resolve the four-minute camera difference, the exact impact time, visibility, or responsibility.

The worksheet would record the statewide finding in layer one. In layer two, it would list each event timestamp with its source. In layer three, it would note that the camera clock has not been verified, the report time may be estimated, and the first 911 call followed the event by an unknown interval. The next step is to seek clock-offset information or surrounding footage, not to choose the timestamp that best fits a theory.

Place requires the same restraint. If the narrative says “at the intersection” but the diagram marks a point beyond the crosswalk, preserve both statements. Compare measurements, camera perspective, road geometry, and the dataset’s coding definition. Do not alter the diagram to make the locations match.

This example is intentionally incomplete. Real records may support different explanations, and some records may never be available. The value of the method is traceability: another reader can see what came from population data, what came from the event, what remains uncertain, and what follow-up was attempted.

Mistakes and red flags to avoid

Avoid claiming that a statewide percentage predicts what happened in one crash. Do not mix fatal crashes with serious injuries, final FARS data with provisional SWITRS data, or California measures with national estimates. Do not treat a missing TIMS row as proof that no report exists, because the tool excludes property-damage-only crashes and recent data may be incomplete.

Be cautious with screenshots stripped of filter settings, maps without dates, copied charts without source labels, and social posts that give numbers without definitions. A precise percentage can still be misleading if the denominator, severity, year, or geography is missing.

Do not overwrite original media, fabricate a cleaner diagram, guess a clock offset, contact a represented party directly, trespass for a photograph, or publish private medical and identity information. Do not state that Hurt Advice or a participating lawyer represents you unless a lawyer has actually accepted the matter under a written agreement.

Finally, do not mistake a records list for a promise that every item exists or will be released. The right response to uncertainty is a documented limitation and a careful next question.

Careful next steps

Finish with a one-page summary containing the event identifier, the dataset and access date, the three most important confirmed event facts, the three largest gaps, and the next custodian or source to contact. Attach a record index rather than forwarding an unsorted folder. Keep a private copy and share only what is necessary.

Read the Hurt Advice editorial standards and source policy to understand how this article handles sources and uncertainty. Hurt Advice is a lawyer-referral and legal-information service, not a law firm. This guide provides general information and does not create an attorney-client relationship.

If you want to ask whether Hurt Advice can help connect you with a participating independent lawyer, use the contact page. An intake response is not a promise of representation or any outcome. Preserve possible time-sensitive evidence and seek individual legal advice when rights or deadlines may be affected.

Frequently Asked Questions

What do California pedestrian crash data say about time of day?
SafeTREC’s 2023 California summary reports that 51% of fatal pedestrian crashes occurred from 6 p.m. to midnight. That is a statewide descriptive pattern, not proof of the time, visibility, cause, or fault in a particular event.
Can SWITRS or TIMS prove what happened in my pedestrian crash?
No. SWITRS and TIMS can provide coded crash information and broader patterns, but an individual event should be checked against its report, diagram, timestamps, photos, video, witness information, roadway records, and medical-response documentation. Recent data may also be provisional.
Why might a pedestrian crash be missing from a TIMS search?
TIMS focuses on fatal-and-injury SWITRS records and excludes property-damage-only crashes. Filters, coding, data-update timing, location details, or an incomplete recent record can also affect results. A missing row is not proof that an incident did not occur.
Which timestamp should I use for a pedestrian crash timeline?
Do not choose one automatically. List each clock and how it was created, including report estimates, 911 and CAD times, camera displays, signal records, EMS times, and medical arrival. Preserve original values and document any supported clock offset separately.
How quickly should nearby video be preserved?
As soon as a relevant source is identified, send a narrow preservation request that names the location, date, and reasonable time range. Retention varies and preservation does not guarantee release. Keep proof of delivery and avoid demanding unrelated footage.
Does Hurt Advice provide legal representation?
Hurt Advice is a lawyer-referral and legal-information service, not a law firm. Information on this page is general and does not create an attorney-client relationship. A participating independent lawyer must separately accept any representation under a written agreement.

Sources and references

primary-studyTIMS SWITRS Summary

UC Berkeley tool for mapped and tabular fatal-and-injury SWITRS data with severity, city, county, and road-user filters.

Need help after an accident?

Hurt Advice intake team can review your situation, explain your options, and help you move forward with a plan that fits your case.